Case study
Symptom Statistics: Turning symptom data into therapeutic insight
Designing the Symptom Statistics feature for a menopause support app that became a prescribable digital therapeutic in 2026, in close collaboration with the team’s clinical scientists.
View outcome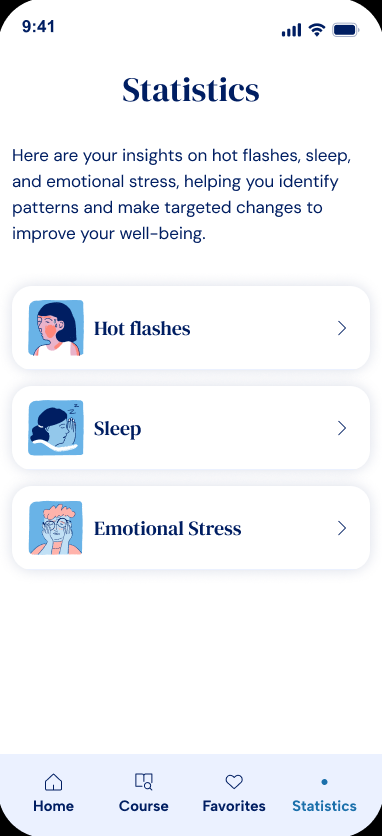
Project Context
An in-house team, built from scratch
When I joined, the product was mid-transition: an external agency had owned design, product, and development up to that point, and the company was bringing it all in-house to get the app ready for a clinical trial. . The CPTO and Tech Lead had just joined; there was no dedicated designer yet.
My first weeks went into auditing the screens already live, pulling out the patterns that worked, and adding them into a small design system.
The problem
My first feature ownership was Symptom Statistics: the part of the app that helps patients track their symptoms and recognize the situations in which they occur.
The initial scope covered three tracked symptoms: hot flashes, emotional stress, and sleep. This case study focuses mainly on hot flashes.
The challenge wasn’t primarily visual. The Science team needed these statistics to do two things simultaneously:
- Apply CBT (Cognitive Behavioral Therapy) principles, surfacing the contexts in which symptoms were strongest, and which coping strategies actually reduced them.
- Show symptom evolution over time, so patients could see measurable improvement.
Symptom Statistics has stayed a core module ever since, inside the product that later ran the clinical trial covered under Outcome.
Starting point
Starting from an existing tracker
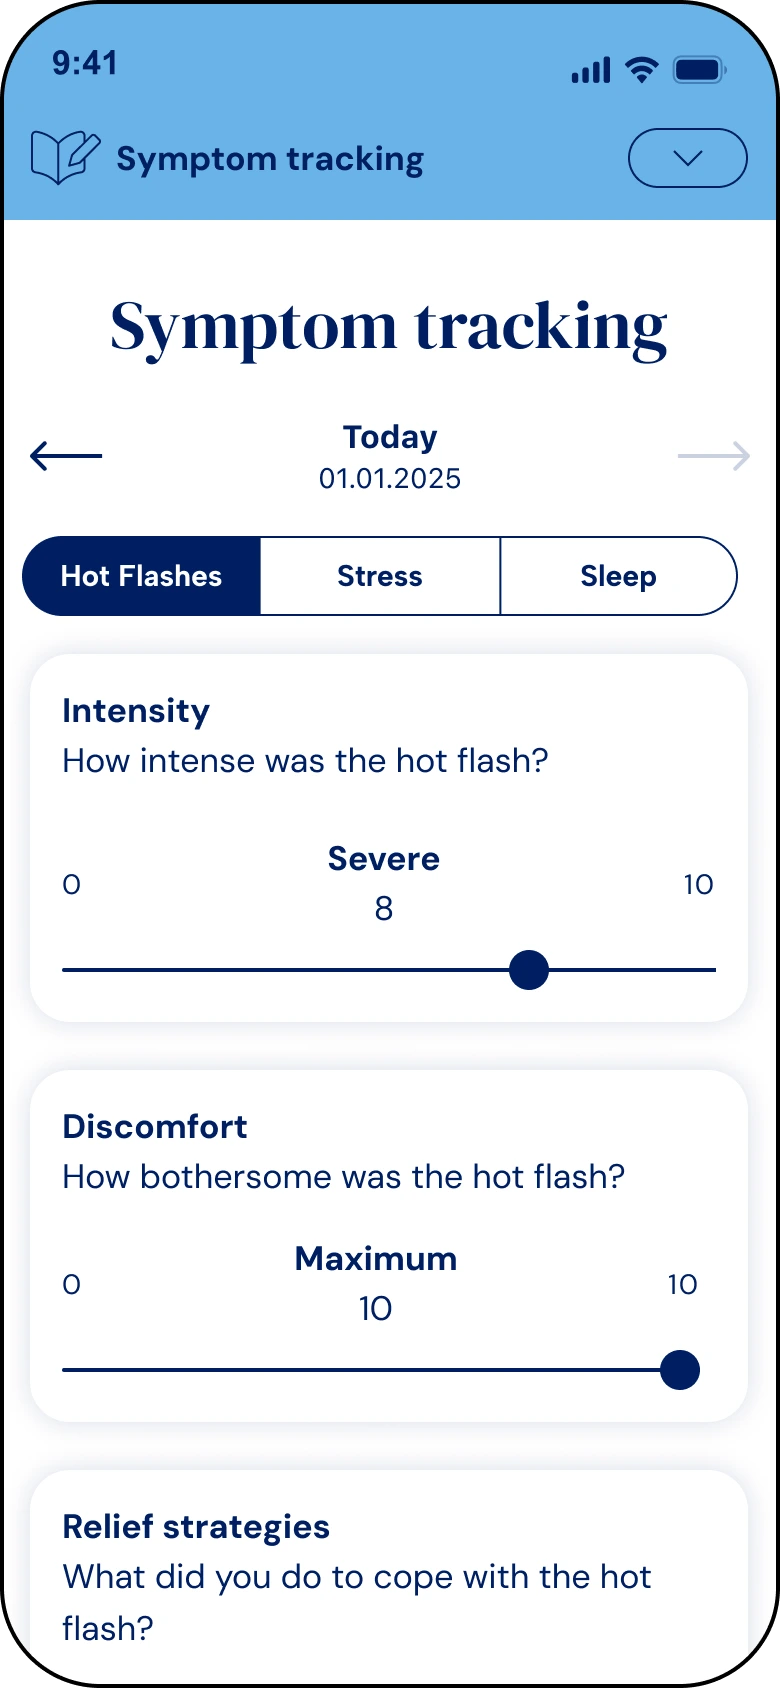
Each entry combines context questions, some single-select and some multi-select (where the patient was, who was with them), with severity sliders from 0 to 10. Hot flash entries also list coping strategies, each followed by a “Did this help?” question.

Process
1. Working with the Science team
Defining the taxonomy
Together we mapped out which categories mattered most to a patient trying to understand her own symptoms: who was present, where she was, what time of day, and which situations helped versus made things worse.
Reduction strategies, the coping techniques that measurably helped, came out as the highest priority, since it’s the most directly actionable thing a patient can act on.
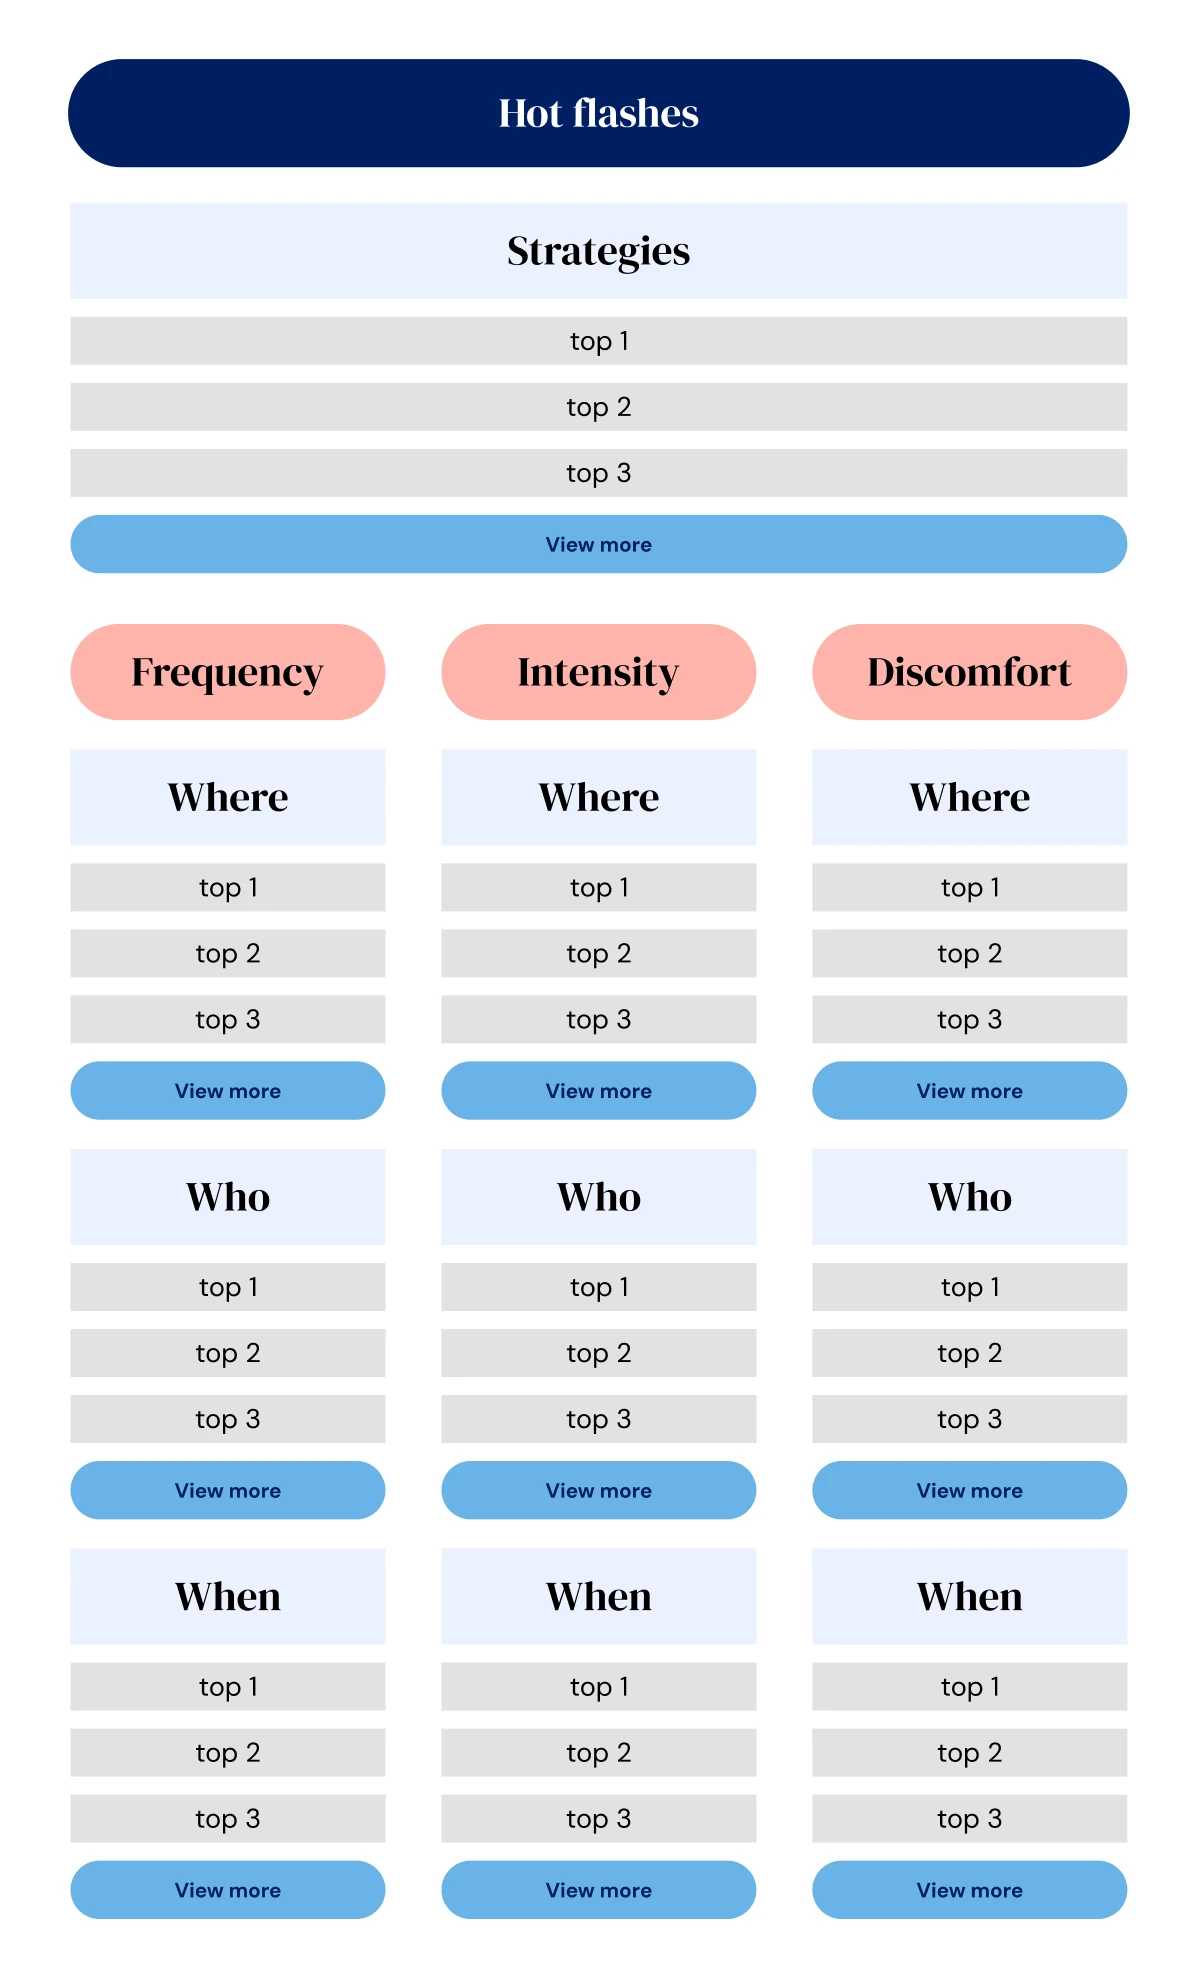
That set the taxonomy: Strategies as its own top-level category, with Where / Who / When broken out separately for each symptom.
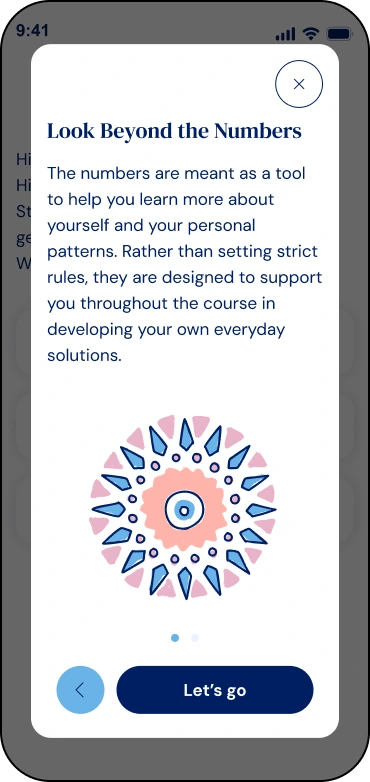
Guarding against misreading the data
One of the more delicate decisions was adding a disclaimer around situational correlations. Raw pattern data is easy to misread: a patient whose hot flashes spike whenever her manager is in the room could wrongly conclude she needs to quit her job, when the real driver might be stress that’s manageable another way.
We added a screen at the entry point of Statistics, shown the first time a patient opens it, explaining how to interpret the data before she sees a single number.
Structuring the symptom parameters
Reviewing the existing symptom tracker, we found that each symptom needed its own data structure. The parameters that mattered for hot flashes weren’t the same ones that mattered for emotional stress:
| Symptom | Tracked Parameters |
|---|---|
| Hot flashes | Frequency · Intensity · Discomfort |
| Emotional stress | Discomfort · Irritability · Anxiety · Depressed Mood |
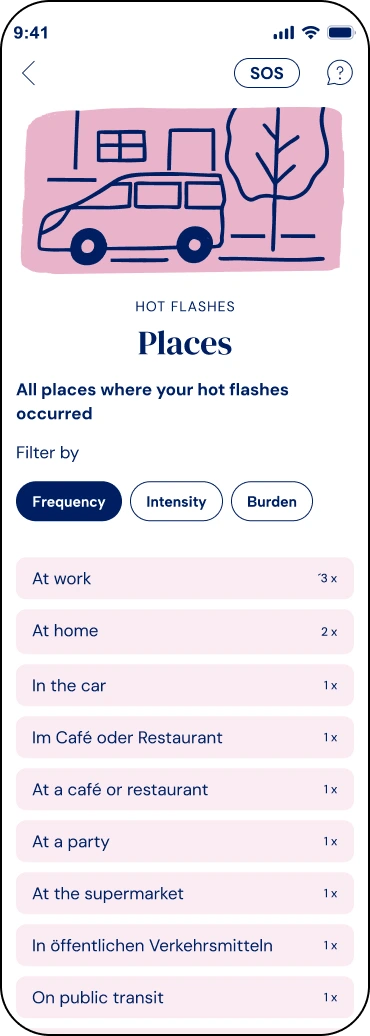
Hot flashes had three parameters to explore, stress had four. Showing them all at once would have been too much, so I designed a simple pill filter: it opens on Frequency, and the user can switch to another view without leaving the screen.
And the two don’t always agree. “In the car” came up only once, so it’s last on Frequency. But that one time, she rated it "9 – Extreme", so it jumps to the top on Intensity.
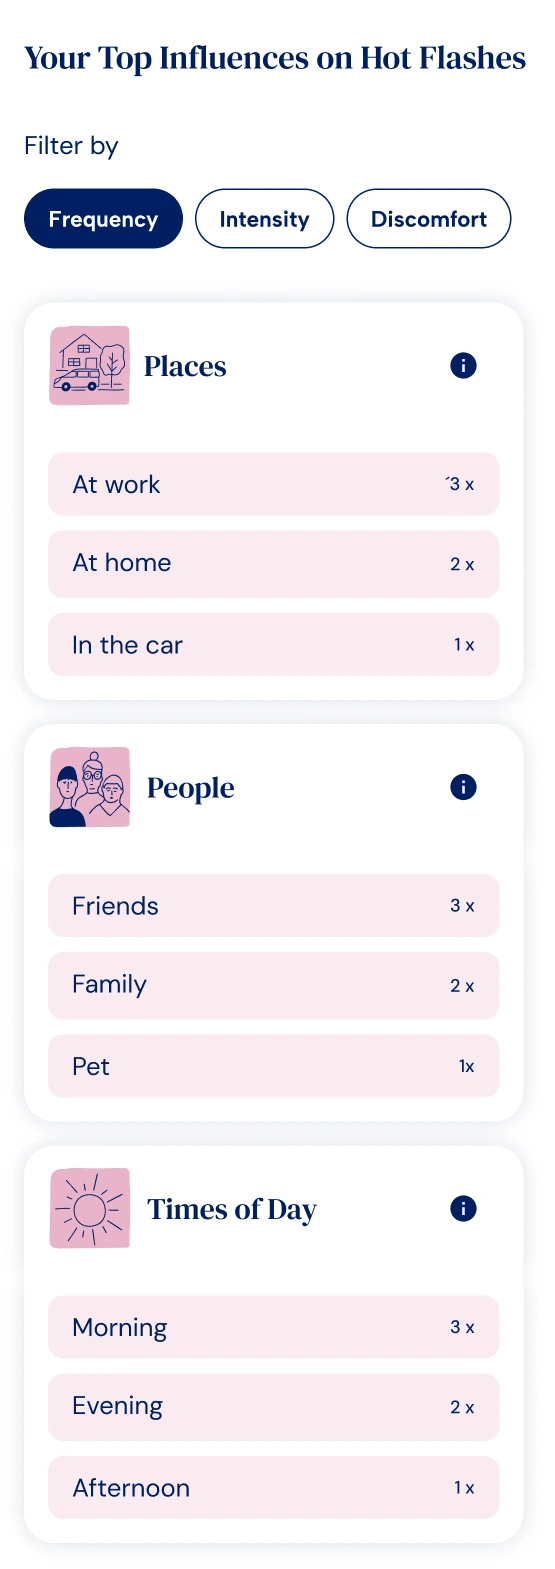
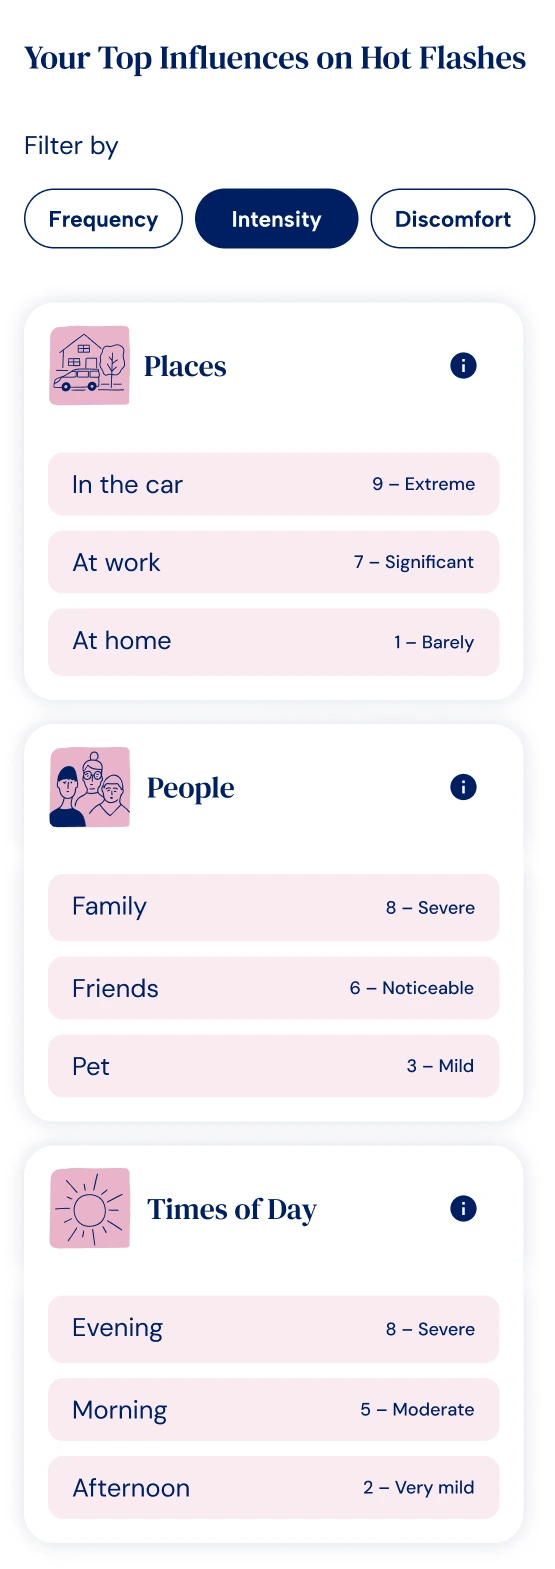
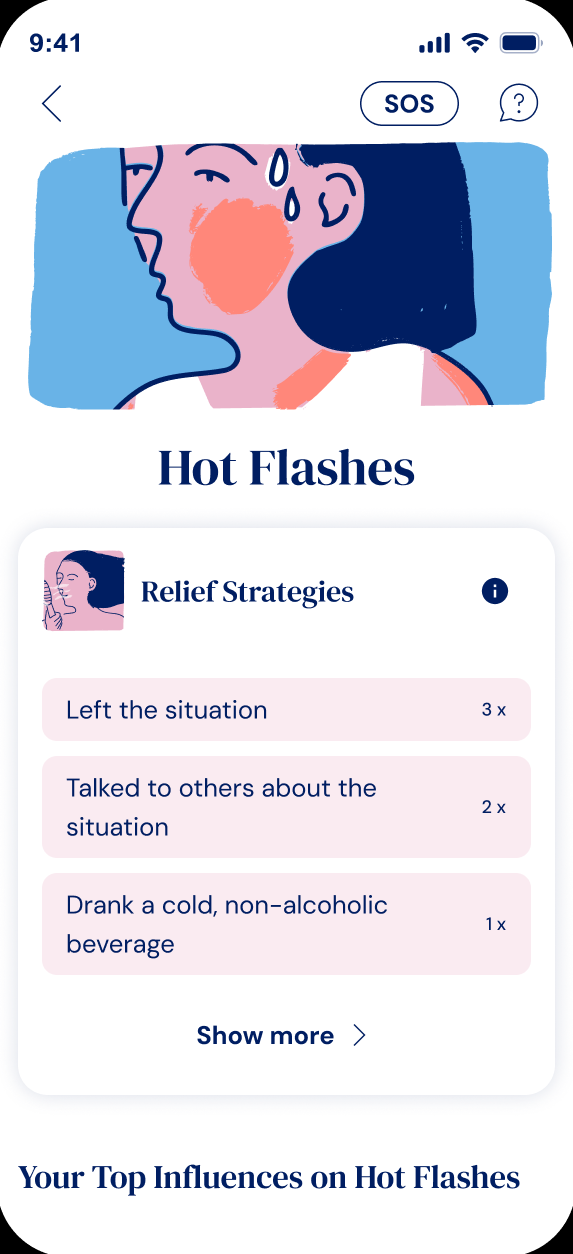
Both the Where/Who/Time breakdown and the Strategies list use the same pattern: a short preview of the top 3 on the main screen, with “view more” expanding to the full, re-sortable list. Strategies stays ranked by frequency throughout, since it isn’t tied to a severity scale the way locations or people are.
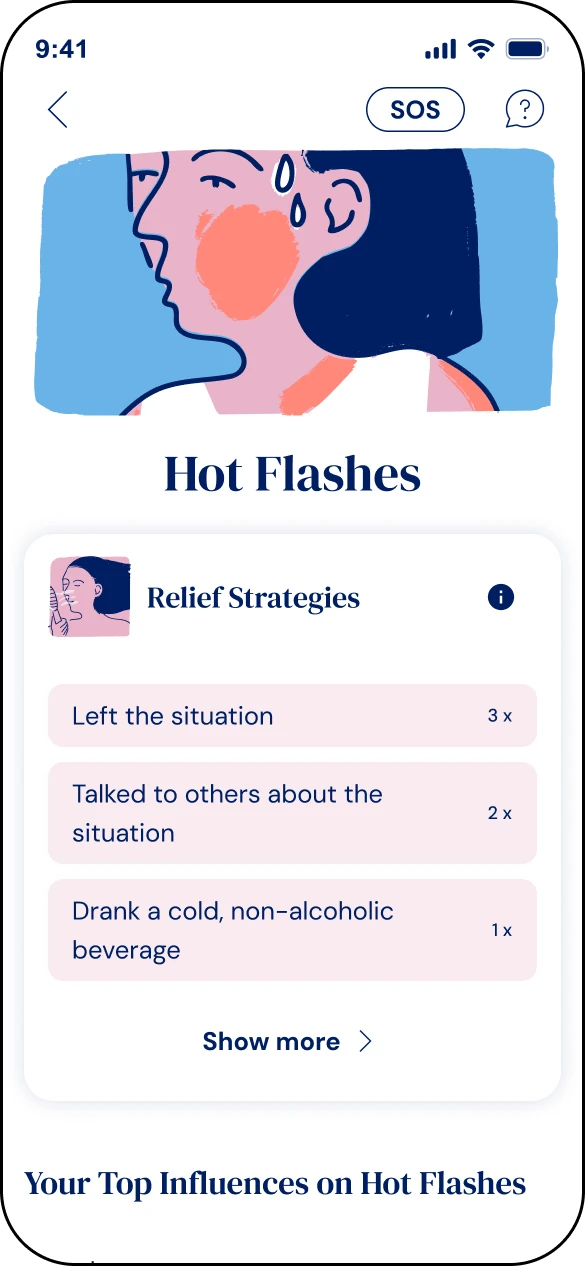
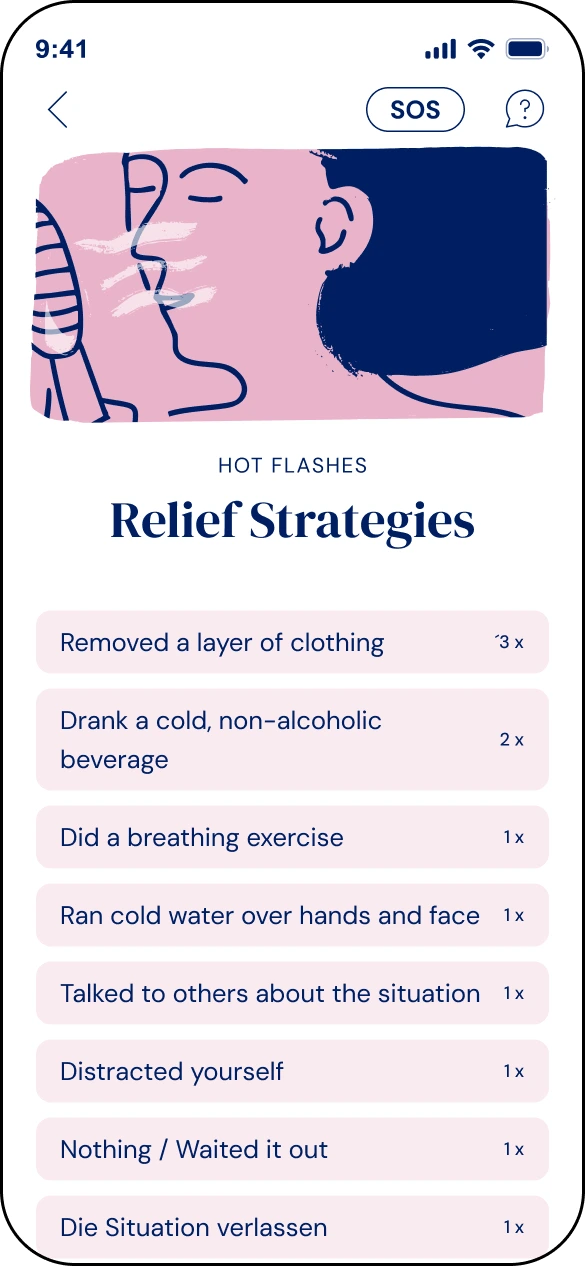
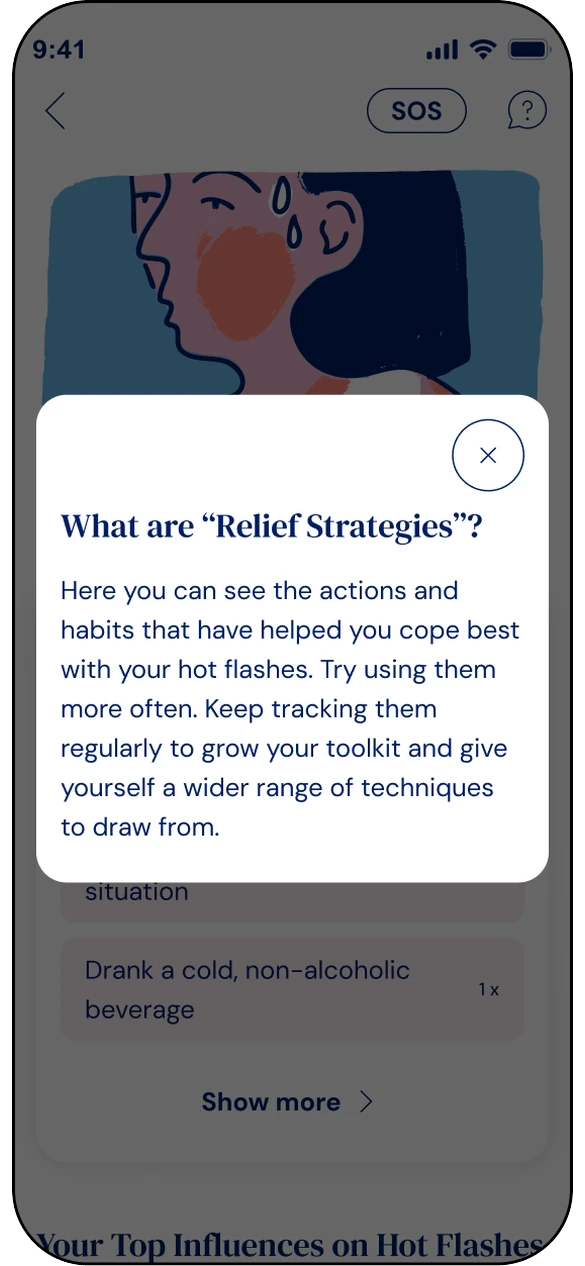
Expanded ‘Places’ subpage for hot flashes, reached via ‘view more’, listing every location ranked by frequency, with the same Frequency / Intensity / Burden filter pills repeated at the top so the ranking can be changed without leaving the page
2. The visual system
To help patients tell symptoms apart at a glance, I assigned each one a distinct color, visible throughout the onboarding and home screens above, then worked with the team’s illustrator to produce:
- A banner illustration for the top of each statistics screen, representing the symptom in focus
- A smaller square format for the symptom-selection screen
- A set of “illucons”: icon/illustration hybrids, part icon, part illustration for each parameter, so the parameter list would feel inviting to browse rather than reading like a plain settings menu
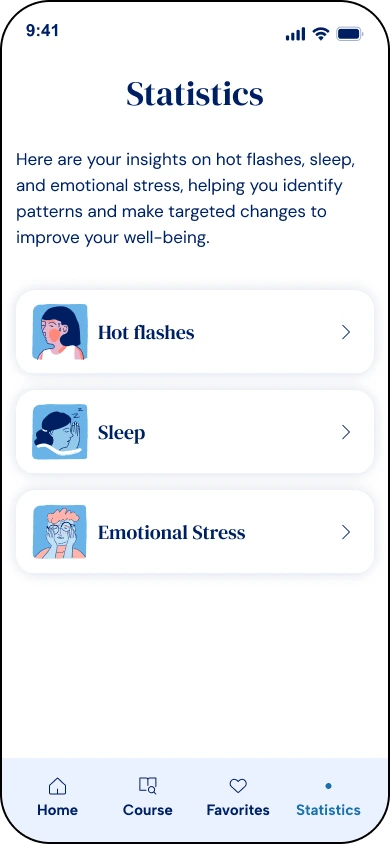
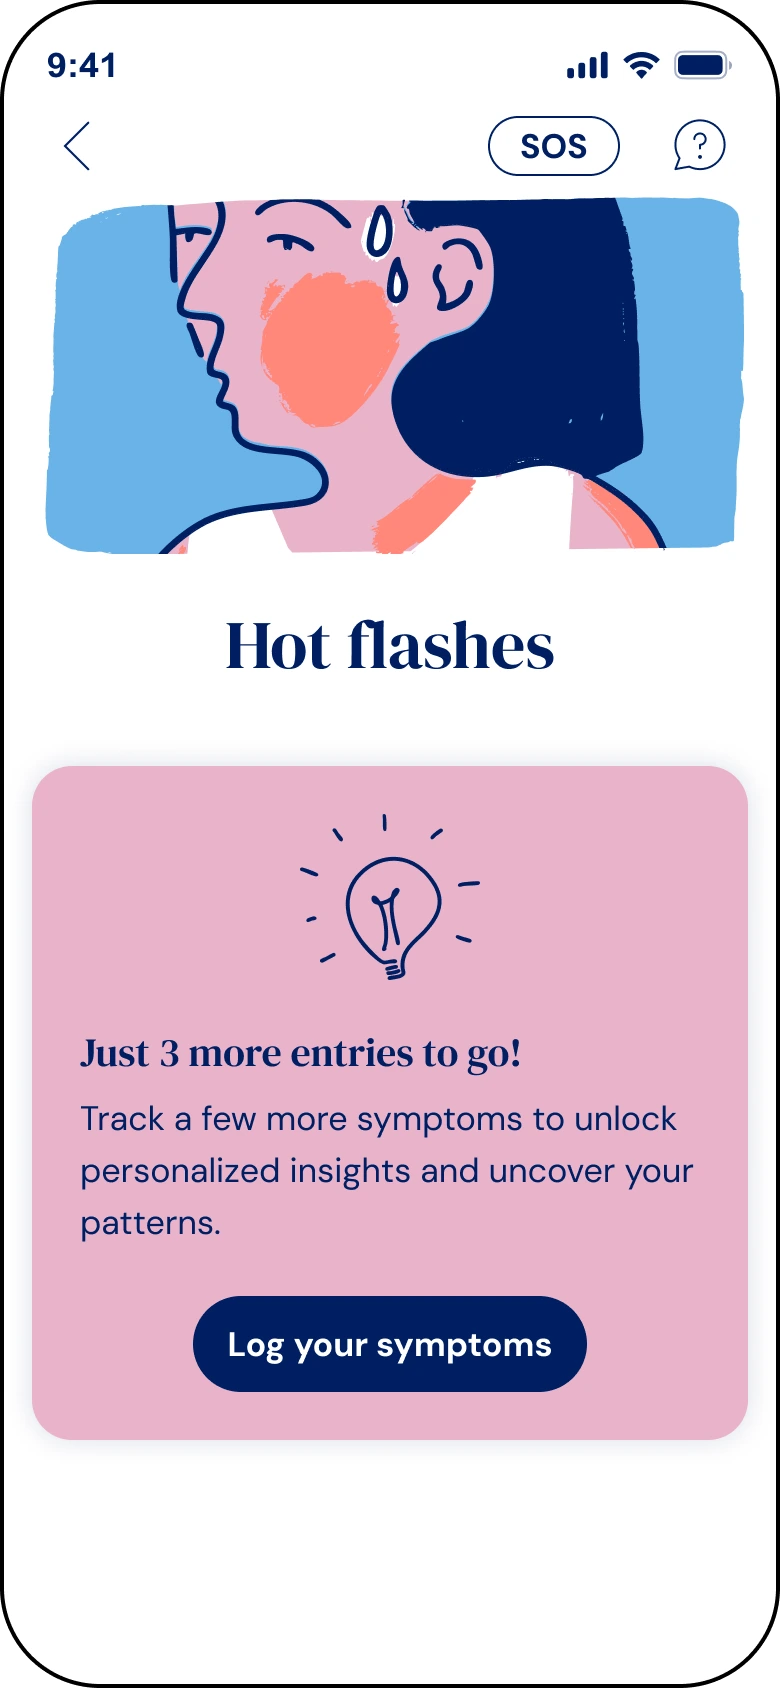
Design proposals were mine to drive, but the decisions that mattered most: taxonomy priority, disclaimer wording and placement, parameter structure, were made jointly with the Head of Product and the Science team, with the Tech Lead brought in wherever a choice carried real technical trade-offs.
Balancing scope and delight
A recurring tension throughout this project was keeping scope as small as possible while still shipping something patients would actually want to keep using. Symptom statistics only work if patients keep logging so the module had to earn repeated use, not just present data correctly.
Most of the delight came from choices that added little technical scope: the illustrated banners and illucons, the ranked Relief Strategies card, framing the empty state as an invitation, “soon you’ll be able to learn more about yourself,” instead of an error state. None of it needed new data. It just changed how the existing data felt to look at.
Iteration
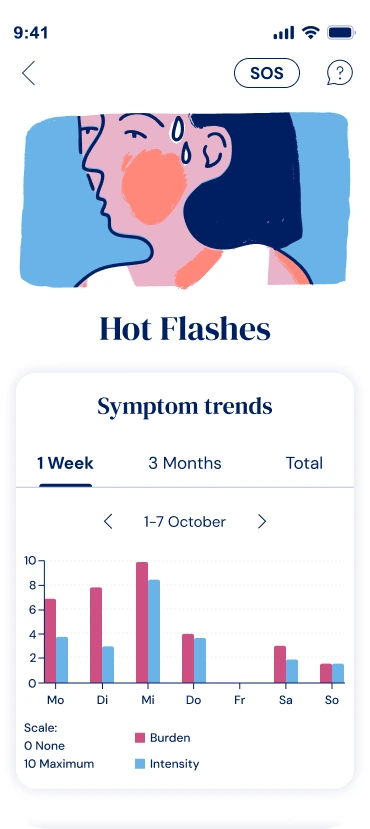
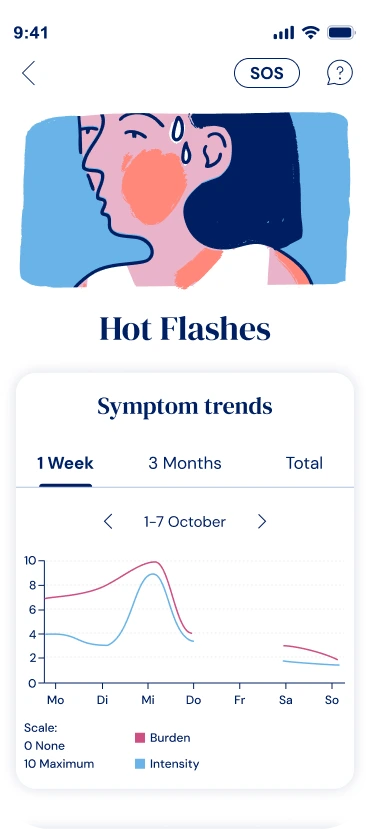
Visualizing progress over time
A view of symptoms over time didn’t make it into the MVP. We had a launch date tied to the clinical study, and we wanted the CBT approach at the heart of the app, so triggers and relief strategies came first. A trend graph wasn’t part of what the study measured, and clinicians already had their own way of following their patients.
But it didn’t stay off the list for long. Once we launched, user testing and the clinical study pointed to the same thing: patients wanted to see how they were doing. It also mattered for retention, because seeing progress is what keeps people logging. And it would give doctors a clearer picture of how their patients were doing after prescribing the app.
I picked it back up at the end of almost a year later. My first idea was three ranges: a week, a month and three months. Then our Head of Product reminded me that some patients use the app for six months to a year, and they’d want to see their whole journey in one go. Fair point. We settled on a week, three months and all time.
I also wanted a bar chart for the weekly view, where daily values read more clearly, and a line chart for the longer ranges. The developers preferred one chart they could reuse everywhere, which made sense for a small team. So we went with the line chart. It handled long periods well and was still easy to read week by week. It went live in summer 2026.
Outcome
The app’s clinical efficacy was tested in a 12-week trial with 100 participants, run in partnership with an academic medical center and published in a peer-reviewed journal in late 2026.
- 71%reached a clinically relevant improvement
- 53%reduction in menopause symptoms overall
- 42%less burden from hot flashes and night sweats
- 94%completed the full study
- 0serious side effects reported
These results describe the app as a whole: clinical trials measure the product, not individual features. Symptom Statistics played its part by giving patients a reason to keep logging, and nearly all of them stayed until the end.
I can’t show feature-level impact here. As a small team working under MDR requirements, we couldn’t track everything we would have liked to, and as an external designer, I didn’t have access to the trial data. If I had, I’d have looked at how often patients logged, how often they opened their statistics, and whether retention changed after the trend graph launched.
Lessons learned
Working so closely with the Science team meant the therapeutic logic was solid from day one. Most of what I knew about patients came through their clinical expertise, which was invaluable. Still, I missed hearing from patients directly: sitting down with a few of them is how I like to work, and it’s often where the most useful details come up.
With the clinical study setting a tight timeline, our priority was to ship a product grounded in clinical evidence. Alongside that, the team tested several designs and features asynchronously with a pool of users, which gave us useful feedback along the way.
Next time, I’d build in a few short moderated sessions before launch: sitting with a handful of patients to check they read the statistics the way we intended, and to catch anything that makes sense to clinicians but less so to someone using the app alone at home. In health, that difference matters even more.
Keep reading
More case studies
Let's talk about your project
Book a free 20-minute call to talk through your project and see how I can help. Or, if you'd rather, just send me a message.
How the call works
- 1. You tell me about your project and your team.
- 2. I share how I could help.
- 3. We agree on next steps.
The booking calendar is provided by Cal.com, a US-based service. It only loads if you click “Show the calendar”. Cal.com then receives your IP address and may set cookies. Learn more